Loading
Orderflow charts are coming to NukeAlgo: footprints, delta, volume profiles and large prints, with Nuke AI marking what matters and reading the flow with real orderflow strategies.
In development. The charts on this page are examples.
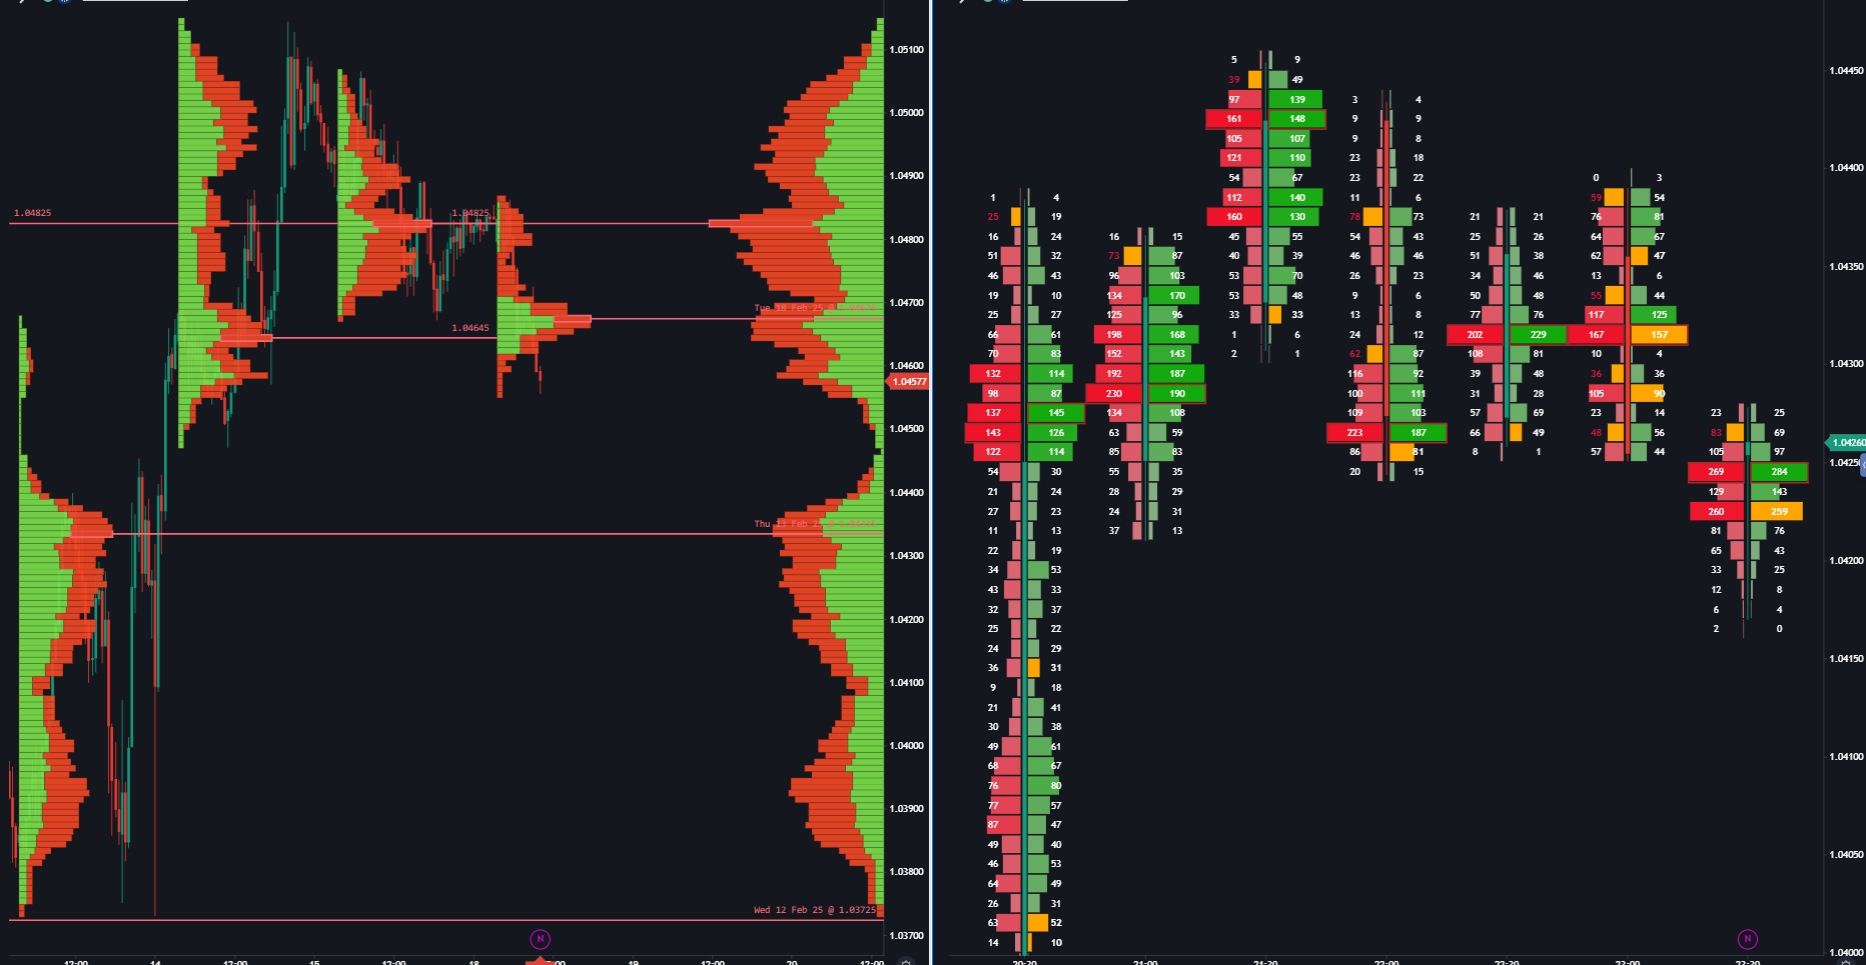
Candles show where price went. Orderflow shows how it got there: who bought, who sold, at which prices, and how hard each side pushed. These are the tools we're building, all on the same chart as everything else you trade.
Every candle opened up: the volume bought at the ask and sold at the bid, at every price.
Who was more aggressive on each bar, and the running total that shows when one side takes over.
Where the volume actually traded, with the point of control and the value area marked.
Unusually big trades sized by volume and split into buys and sells, on the bar they hit.
The session's volume-weighted fair price, with deviation bands the market keeps returning to.
Ask about the flow. Nuke AI marks it on the chart and tells you what it means.
Heavy selling into a level that doesn't move price lower: someone bigger is taking the other side.
Three or more prices in a row where one side traded far more than the other: initiative, not noise.
Price makes a new high while delta doesn't: the push is running out of real buyers.
A burst of volume at the extreme of a move, then nothing: the last buyers or sellers are in.
A high or low that closed with trades on both sides: price often comes back to finish it.
Price tests outside the value area and is pushed back in: a fade toward the point of control.
Nuke AI will read the chart with orderflow strategies, not just indicators: each one has its own conditions, entry, stop and target, checked against the flow before it suggests a trade. And NukeX will be able to turn them into strategies you can backtest.
Absorption at a known level, confirmed by delta flipping: a reversal entry with the stop beyond the absorbed prices.
Stacked imbalances in the trend's direction, then a pullback into them: a continuation entry.
A new high or low on weaker delta, at resistance or support: a fade back into the range.
Price reclaims VWAP with cumulative delta turning the same way: a move toward the opposite band.
Orderflow that's estimated from candles looks right and tells you nothing.
Footprints, delta and large prints only mean something when they come from the actual trades. We'll launch Orderflow on markets where we have real trade-by-trade data, and tell you exactly which ones, rather than guess the flow from price.
We're building it now and haven't set a date. Nothing on this page is live yet: the charts shown are illustrations of what's coming.
Until then, Nuke AI already reads structure, liquidity and volume on every chart.